GoJS 在线示例
我们的在线示例展示了如何构建不同的图表类型、相关的功能特性和同步的布局方式,您可以使用这些示例中的 HTML 和 JavaScript 代码作为您的应用程序的起点。
如果您已经看过本页面相关例子并准备自己尝试使用 GoJS,请阅读我们的 快速入门 教程
如果要查找特定 GoJS 方法或属性的示例,可以利用 Github 的搜索功能来查找所有示例、扩展和文档的源代码:

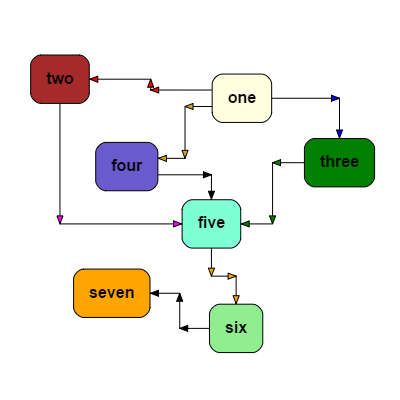
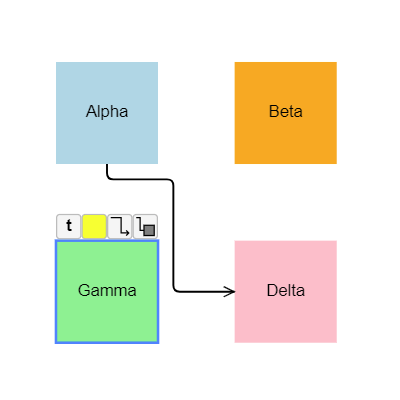
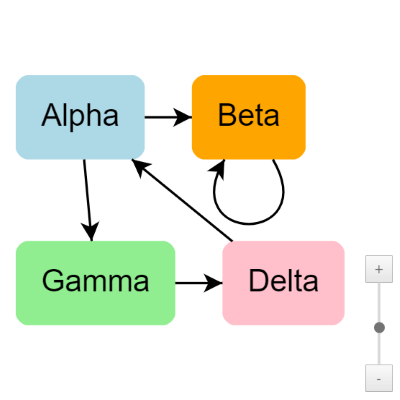
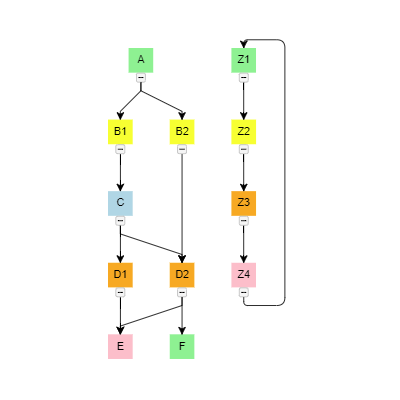
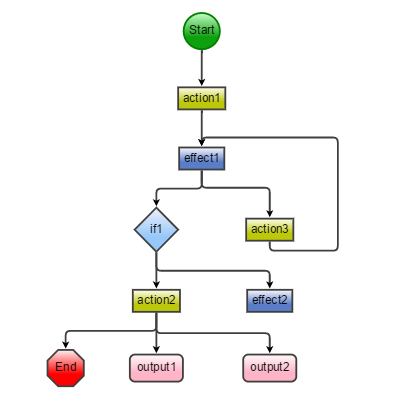
流程图
A standard flowchart, showing different node templates and several data bindings. Each node has 3 or 4 port elements. Links are orthogonal and avoid nodes.

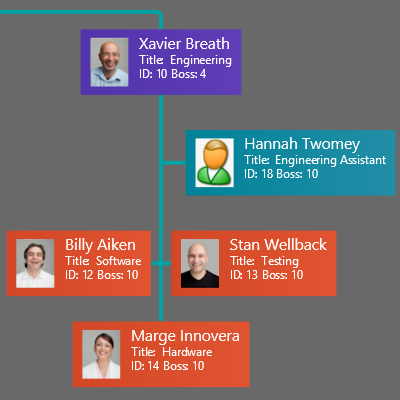
组织结构图
Shows an organizational chart, uses an in-laid Overview to aid the user in navigation, and allows the user to search by example.

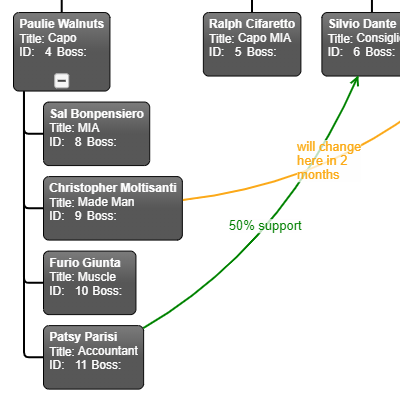
组织结构图编辑器
An organizational chart that allows user editing and re-organizing of the hierarchy.
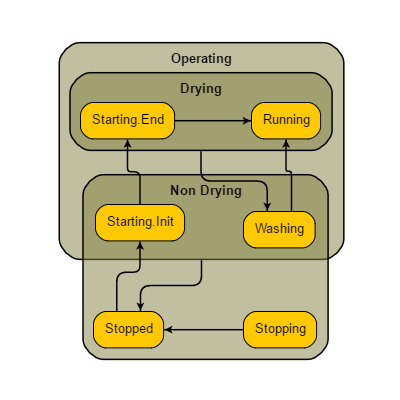
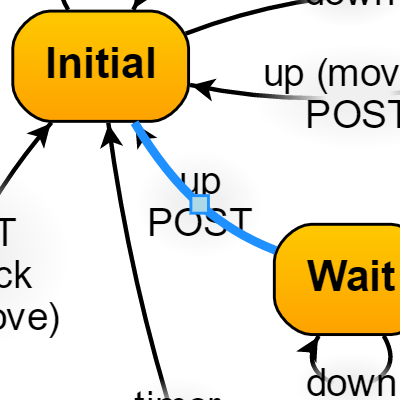
状态图
A state chart diagram that also shows dynamic creation of new nodes and links on a button press.
最简单的例子
Shows default Diagram interactivity and basic data binding. Select, move, copy, delete, undo, redo with keyboard or touch.
基础例子
Shows many of the commands possible in GoJS, templates for Links and for Groups, plus tooltips and context menus for Nodes, for Links, for Groups, and for the Diagram.
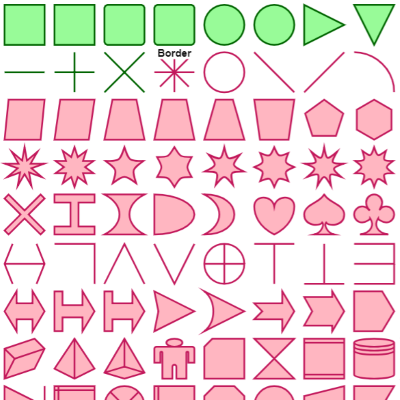
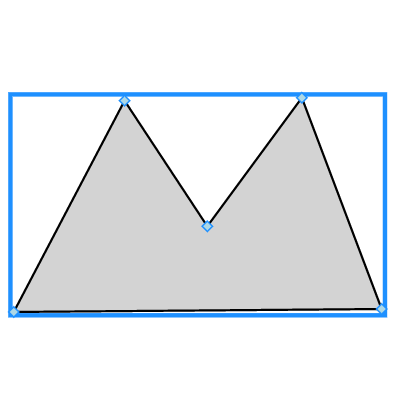
图形形状
Showcases all pre-defined GoJS figures. You can define your own named Shape figures.
SVG 图标
Create your own custom Shapes using SVG path strings. This sample uses SVG strings from a free icon set.

桑基图
Sankey diagrams show the amount of flow between nodes by the width of the links.

PERT
A simple PERT chart, showcasing GoJS table panels and RowColumnDefinition properties.

甘特图
Demonstrates a simple Gantt chart.
欧拉图
A read-only diagram where clicking on a node will open a new webpage.
ER图
An entity relationship diagram, showcasing data binding with item arrays.
UML类图
A UML Class diagram shows software classes and their properties and methods, and the relationships between them.
货架图
Drag-and-drop items from the Palette onto racks in the Diagram.

Class Hierarchy
Displays the GoJS Class Hierarchy as a series of trees. Double-click to go to the class's API documentation.
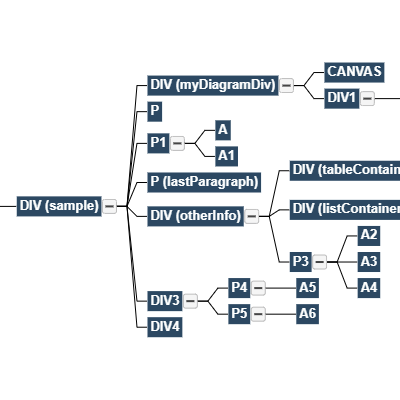
DOM 树
Shows the DOM of this page displayed as a tree. Selection highlights the DOM element in the page.
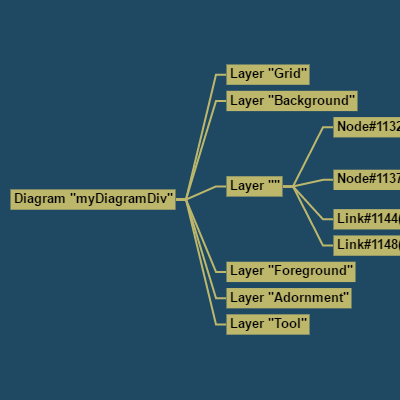
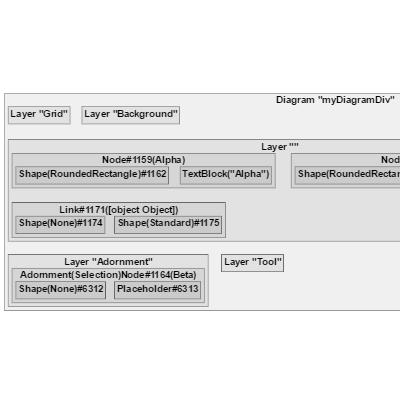
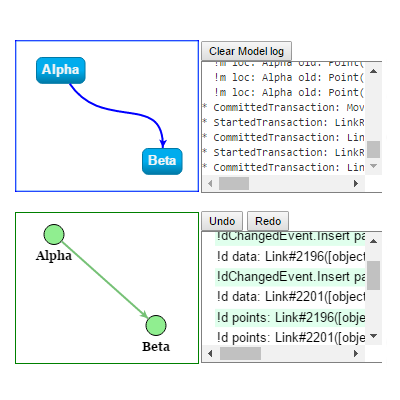
视觉树
This sample shows the actual visual tree of a running Diagram, using a second Diagram.
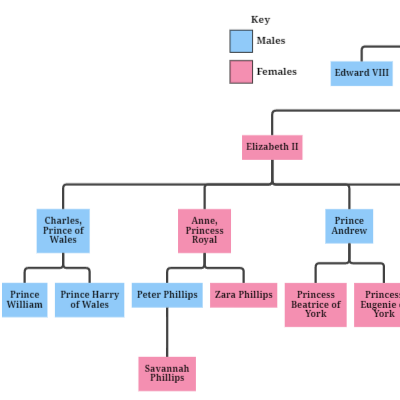
族谱图
Shows a standard family tree.
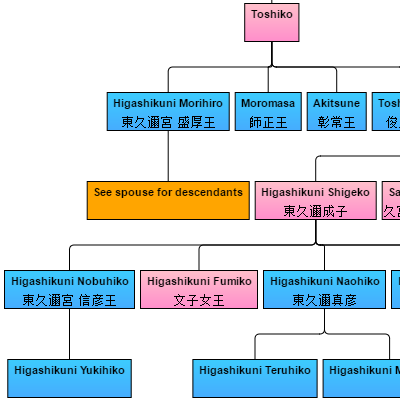
族谱图(日文)
Shows a standard family tree.
Org Chart Extras
Shows an org chart with extra links and expand/collapse functionality.
Org Chart Assistants
Shows an org chart with assistant nodes at the side, above regular child nodes.
局部视图
Two diagrams, the one on top showing a full tree and the one below focusing on a specific node in the tree and those nodes that are logically "near" it.
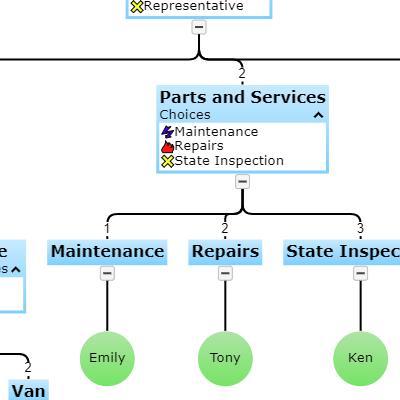
决策树图
Allows a user to make progressive decisions.
Incremental Tree
Demonstrates the expansion of a tree where nodes are only created "on-demand", when the user clicks on the "expand" Button.
双树
Displays a single diagram of two trees sharing a single root node growing in opposite directions, using two layouts.
Double Tree JSON
Double Tree, loading JSON from server.
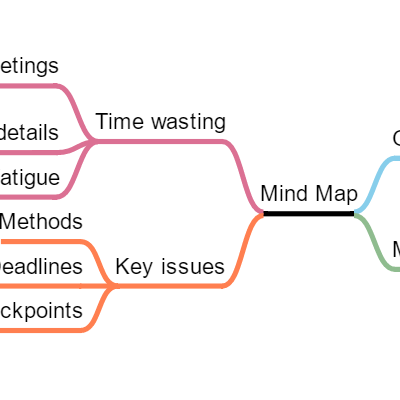
思维脑图
A Mind Map, a double-tree whose nodes have an "add" button when selected and a context menu.
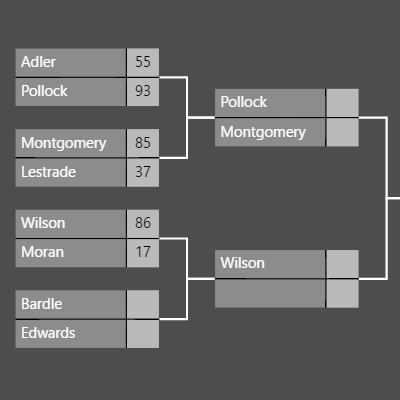
锦标赛图
Tournament bracket with dynamic advancement as scores are entered.
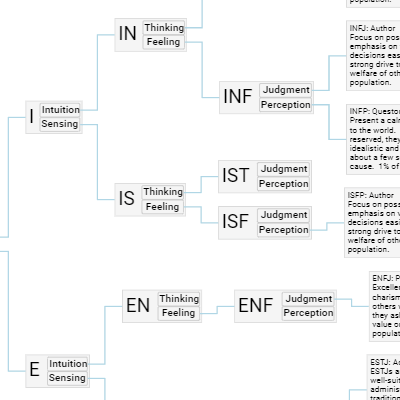
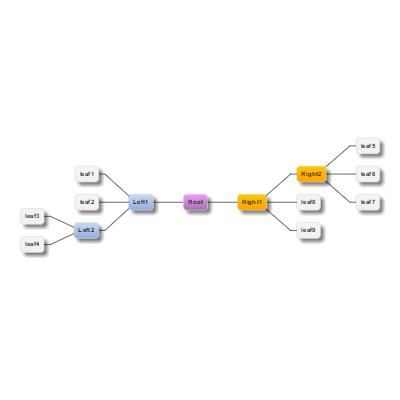
树
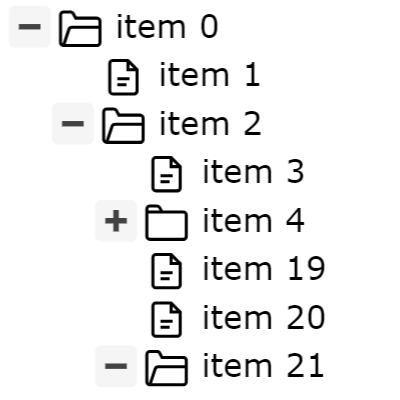
Demonstrates a traditional "Tree View" in a GoJS diagram, with optional orthogonal links between the nodes.
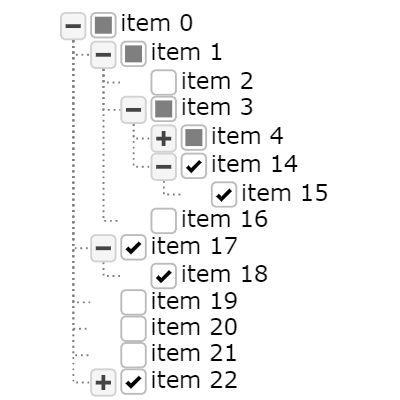
Tri-state CheckBox Tree
Demonstrates a traditional "Tree View" in a GoJS diagram, where each item has a checkbox with three states.

Tree Mapper
Displays two trees, allowing the user to dynamically draw or reconnect links mapping one tree node to another.
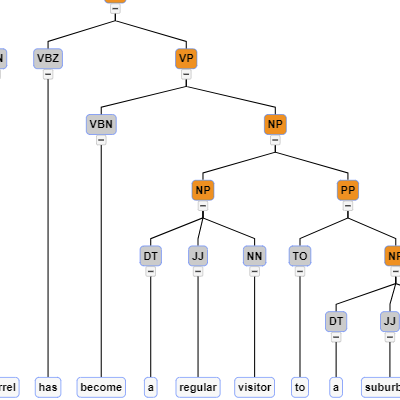
Parse Tree
A Parse tree representing the syntactic structure of a sentence. The leaf nodes are shown in a horizontal line.
Pipe Tree
A tree layout with rectangular nodes at alternating angles and no links.
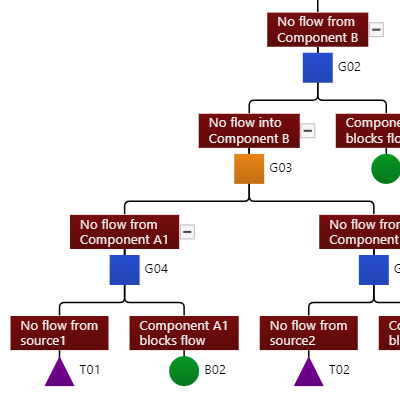
故障树
A fault tree diagram with collapsing/expanding subtrees and gates at each non-root node.
IVR 树
Diagram representation of an Interactive Voice Response Tree (IVR tree). Nodes may have a collapsible list of details.
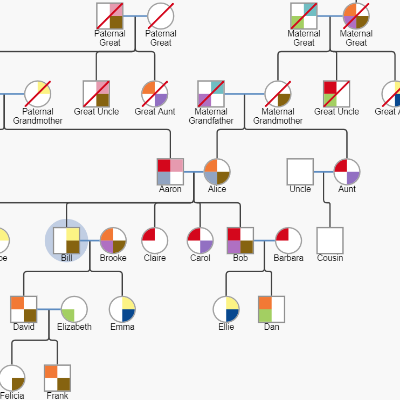
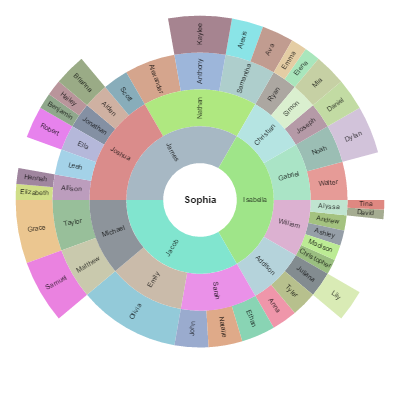
Genogram
A genogram or pedigree chart is an extended family tree diagram that show information about each person or each relationship.
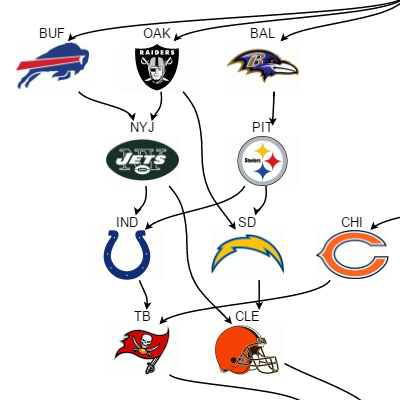
Beat Paths
Demonstrates reading JSON data describing the relative rankings of NFL teams at a particular moment in time and generating a diagram from that data.
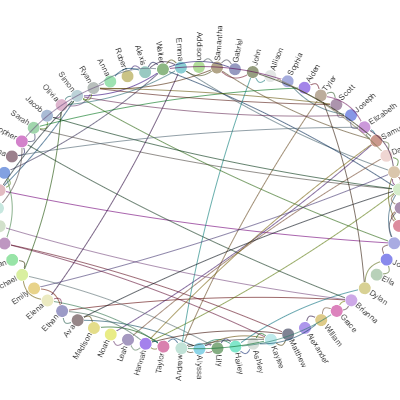
概念图
A web of interlinked concepts displayed with a ForceDirected Layout, showcasing link labels.
Path Animation
Animation of diagram parts (tokens) along link paths.
距离和路径
Show distances between two nodes and highlights one of all possible paths between the nodes.
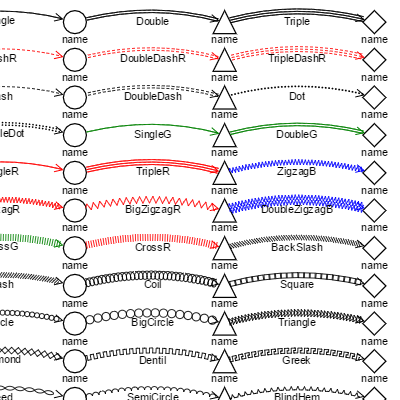
各种箭头
Showcases all pre-defined Link arrowheads. You can define your own named arrowhead geometries.
Relationships
Shows how you can create custom renderings for Links by repeatedly drawing GraphObjects along the route.
Link Curviness
An example customization of the Link.curviness property and having an arrowhead at the middle of the link route.
Multi-Node Path Links
Demonstrates custom routing for Links running through other Nodes.
Tapered Links
Demonstrates a custom Geometry for Link paths.
多箭头
A custom orthogonal Link that draws arrowheads at the end of each segment.

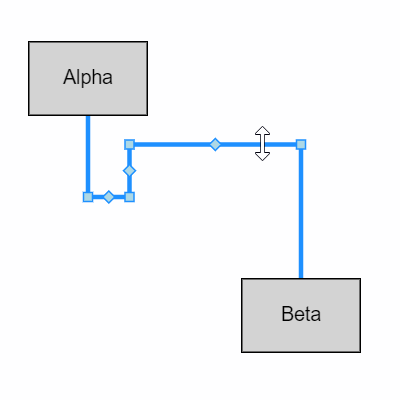
可拖动的连线
Showcases draggable disconnectable links that can be connected by dropping one or both ends at a valid port.
连线相连
Demonstrates the ability for a Link to appear to connect with another Link, using label nodes that belong to links.
Navigation
Displays relationships between different parts of a diagram.
分组
Demonstrates subgraphs that are created only as groups are expanded.
重新分组
Allows the user to drag nodes, including groups, into and out of groups, both from the Palette as well as from within the Diagram.
Rounded Groups
BPMN Choreography that demonstrates subgraphs that have rounded headers and rounded footers.
看板图
A Kanban board editor, allowing the categorization of editable tasks.
Layer Bands
Layer Bands are automatically created for each "layer" of a TreeLayout, and run perpendicular to the layout.
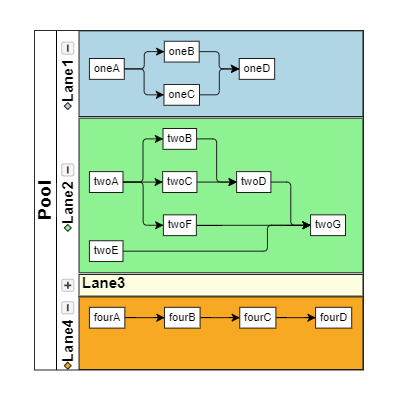
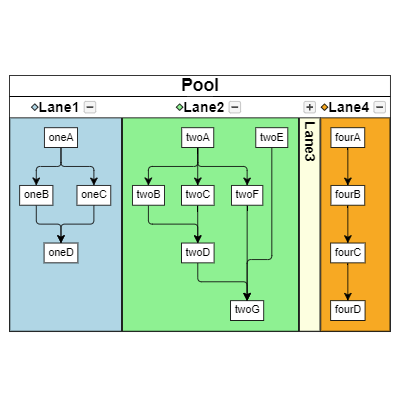
泳道图
Demonstrates collapsible, resizable, re-orderable swimlanes, a kind of process-flow diagram, with custom dragging rules that disallow nodes from leaving their lane.
Swim Lanes Vertical
Demonstrates collapsible, resizable, re-orderable swimlanes, a kind of process-flow diagram, with custom dragging rules that disallow nodes from leaving their lane.
Visual Tree Using Groups
This shows the same visual tree using nested Groups instead of nodes and links.
Shared States
As an alternative to using Groups, this manages Nodes that simultaneously belong to multiple containers.
网格布局
Shows GridLayout and options. Places all of the Parts in a grid-like arrangement, ordered, spaced apart, and wrapping as needed.
树形布局
Shows TreeLayout and options. Positions nodes of a tree-structured graph in layers (rows or columns).

力导图
Shows ForceDirectedLayout and options. Treats the graph as if it were a system of physical bodies with forces acting on them and between them.
分层有向图
Shows LayeredDigraphLayout and options. Arranges nodes of directed graphs into layers (rows or columns).
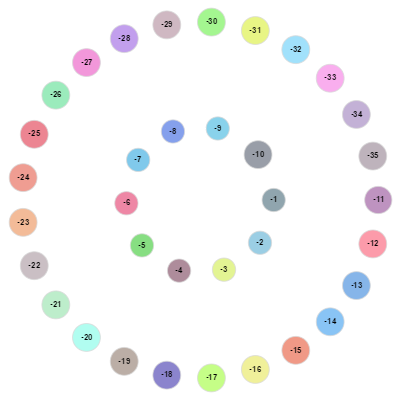
圆形布局
Shows CircularLayout and options. This layout positions nodes in a circular arrangement.

交互性力导图
A continuous ForceDirectedLayout that occurs as the user drags around a node.
双圆图
Multiple circles using repeated CircularLayouts.
好友关系图
Demonstrates a customized CircularLayout.
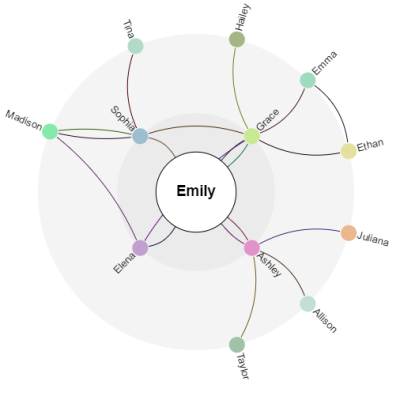
Recentering Radial
Arrange people in circles around a central person, in layers according to distance from the central person.
Radial Partition
Arrange people in rings around a central person, in layers according to distance from the central person.

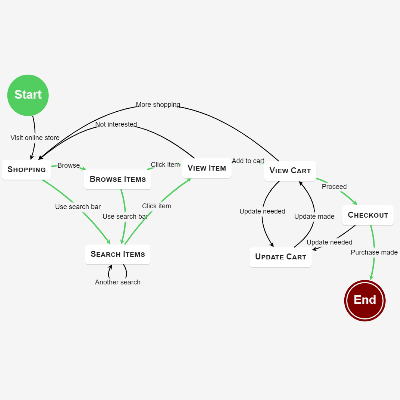
网页流程图
A diagram representation of webpage flow.
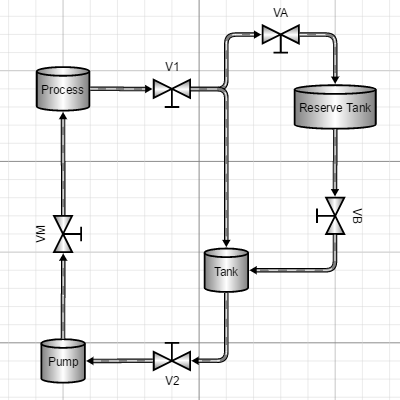
工艺流程图
Tanks, valves, and pipes, with animated flow in the pipes.
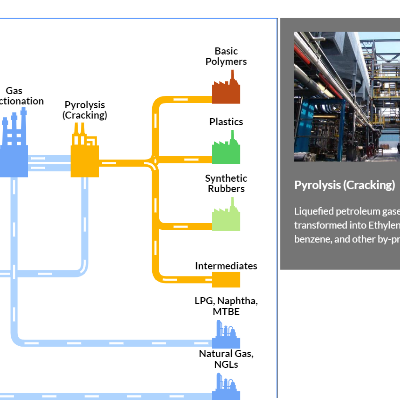
Production Process
Partially describes the production process for converting natural gas and oil byproducts into their end products.
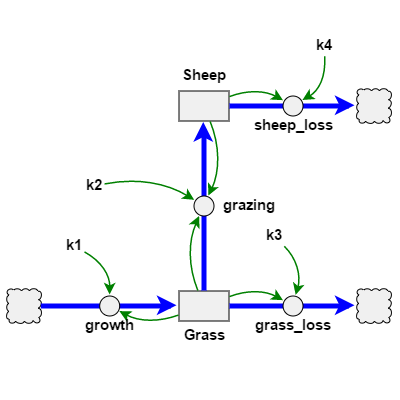
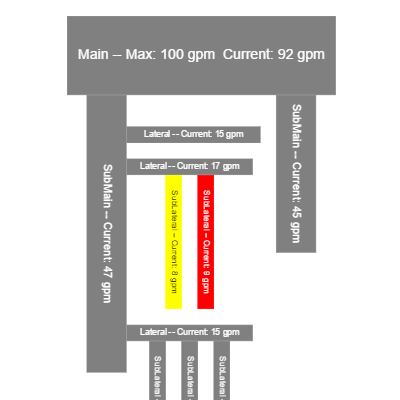
系统动力图
A System Dynamics diagram shows the storages and flows of material in some system, and the factors that influence the rates of flow.
时序函数图
A sequence diagram that shows different node templates, LayeredDigraphLayout and in-place text editing.
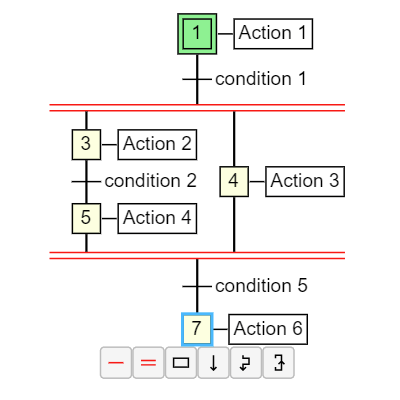
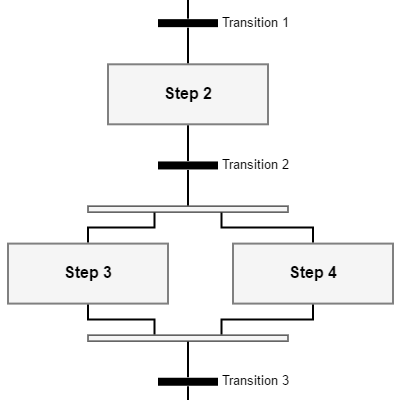
Grafcet 图
A Grafcet is a kind of sequential function chart used in automation design.

序列图
A sequence diagram illustrates how different processes interact with one-another and in what order.

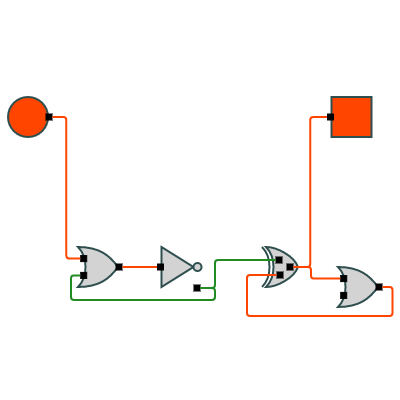
逻辑电路图
A functioning logic circuit diagram, which allows the user to make circuits using gates and wires.
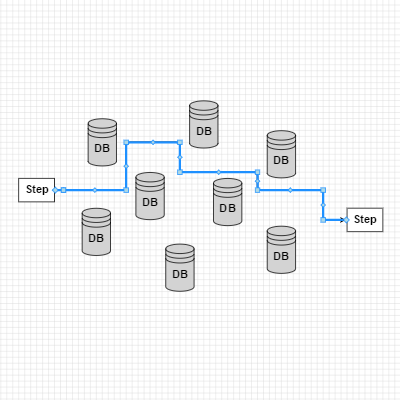
数据流
Show the processing steps involved in a database transformation or query, with labeled ports.
数据流图(竖直方向)
Same as Data Flow, but vertically oriented, and with slightly different styling.
动态端口
Add ports to a selected node by clicking buttons or by using a context menu. Draw links by dragging between ports. If you select a link you can relink or reshape it.
Selectable Ports
A Node with ports that can be selected and deleted.
可拖动的端口
A Group with Nodes acting as ports that can be dragged within and between nodes.
条形图
Simple bar charts or histograms within nodes.

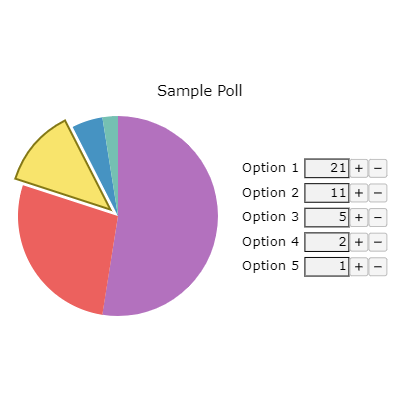
Pie Charts
Simple pie charts within nodes.
蜡烛图
Simple candlestick or range charts within nodes.
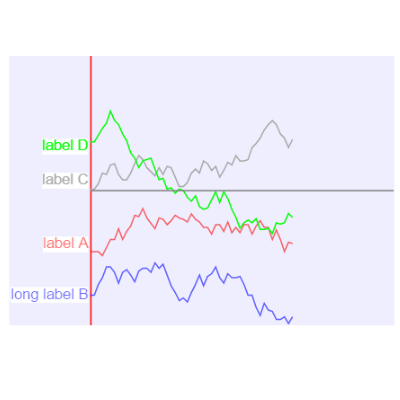
Sparkline Graphs
Simple sparkline charts within nodes.
动态饼图
Dynamic pie chart with selectable slices that can change size.
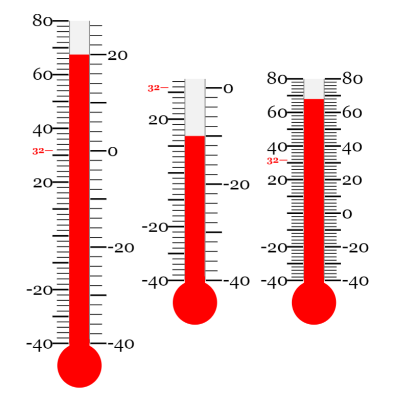
Thermometer
Graduated thermometer scales using Graduated Panel.
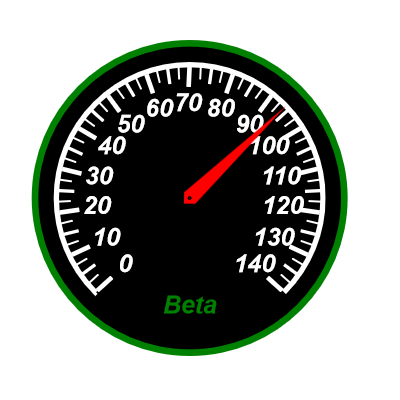
仪表图
A gauge using a scale made with a Graduated Panel.
内容对齐方式
Showcases alignment properties of the Diagram.

HTML 交互
Contains two draggable HTML elements (using jQuery UI). One of the two HTML elements houses a panel that interacts with the main Diagram.
自定义文字编辑器
Demonstrates using a custom HTML element for in-place editing of a TextBlock.
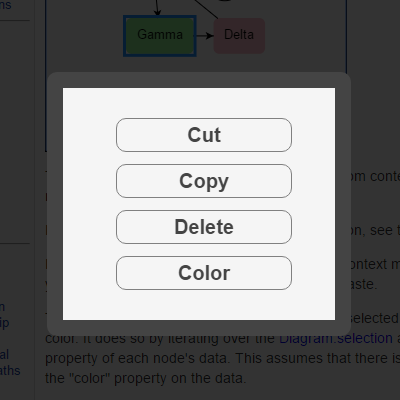
自定义右键菜单
Demonstrates the implementation of a custom HTML context menu.
图表节点
Shows how to render a data-driven chart within each Node using the Chart.js library.
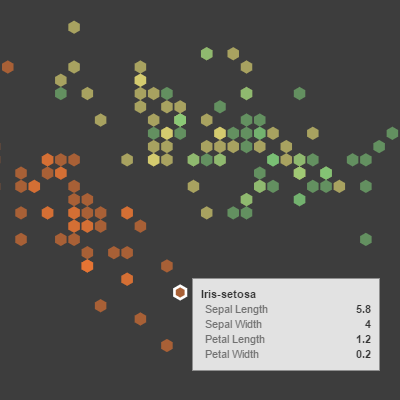
数据可视化
A data-visualization demonstration that showcases GoJS interacting with other elements on the page.
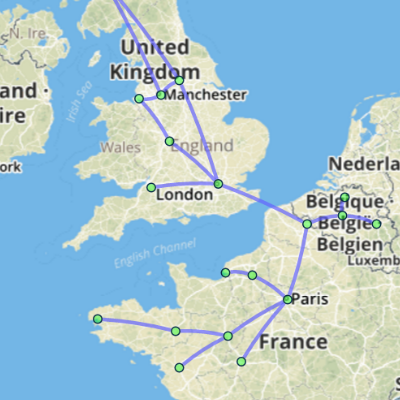
GoJS and Leaflet Map
A GoJS diagram atop a Leaflet.js map, with nodes placed at latitude and longitude based locations.
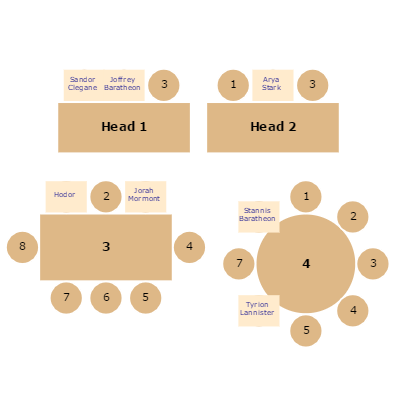
座位表
This sample demonstrates custom logic in a GoJS diagram - a "Person" node can be dropped onto a "Table" node, causing the person to be assigned a position at the closest empty seat at that table.
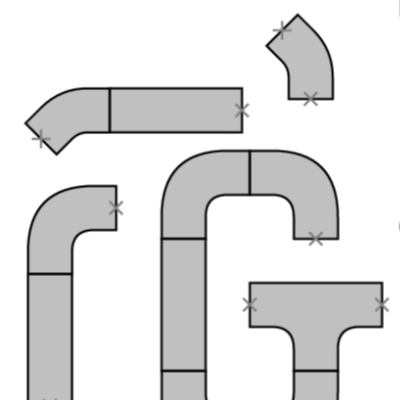
管道形状
Showcasing nodes (Pipes) that can be joined, and will snap and drag together.
Adornment Buttons
Selected nodes show a row of buttons that execute commands or start tools.
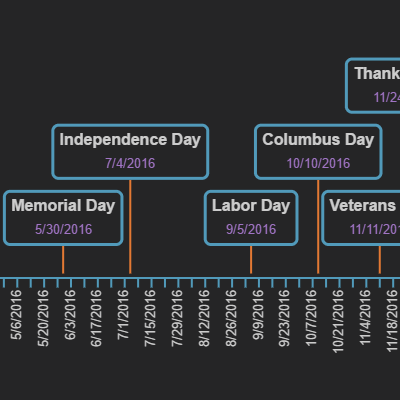
Timeline
A simple timeline with events arranged along a line.
Rulered Diagram
A diagram with Graduated Panels at the edges acting as rulers.
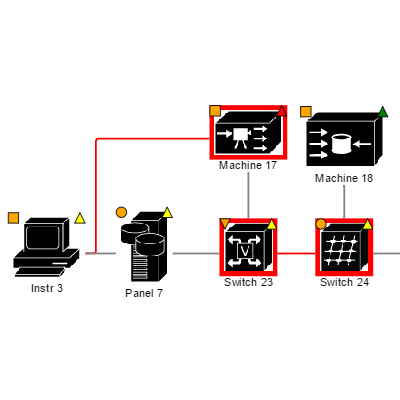
设备监控
Shows the continuously updating state of a number of stations on an imaginary shop floor.
宠物监控
A monitoring diagram where the nodes (kittens) move about a house, with tooltips for each kitten.
Spreadsheet
An example of nested Table Panels forming a spreadsheet-like grid.
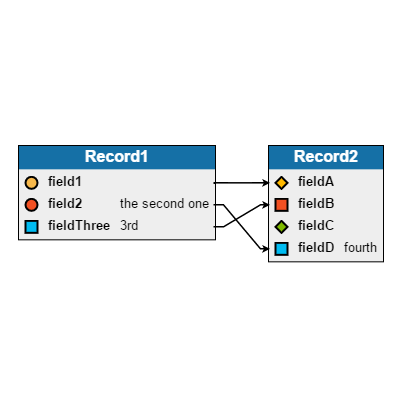
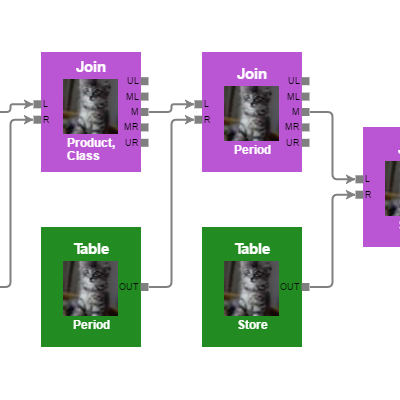
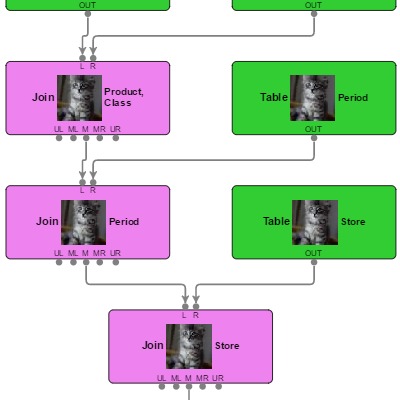
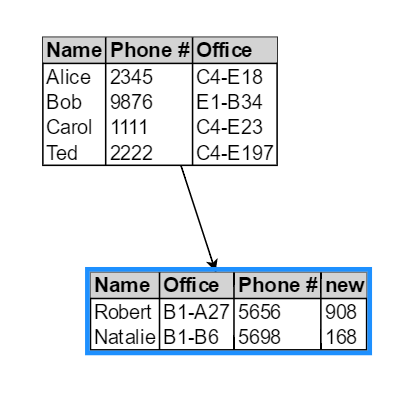
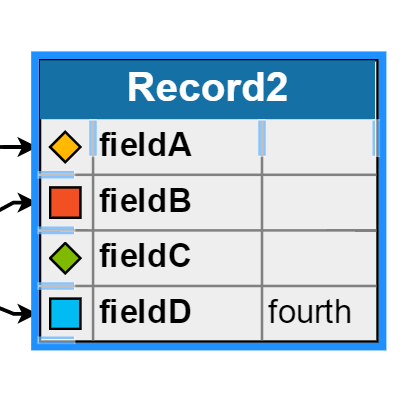
记录映射器
Displays a variable number of fields for each record, with links mapping one field to another.
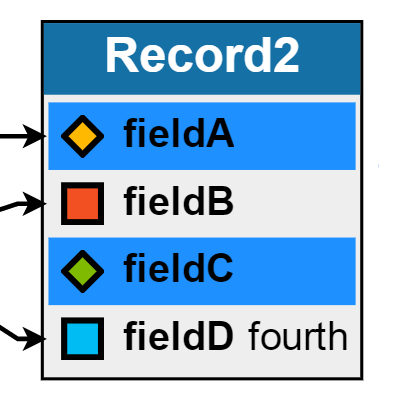
Selectable Fields
Records with fields that the user can select.
增加/删除表格列
Demonstrates adding and removing columns of a Table Panel.
数据同步
Showcases two Diagrams observing the same Model. Modifying positions in one Diagram will modify them in the model, updating the other Diagram as well.
绝对定位
A diagram that does not scroll or zoom or allow parts to be dragged out of a fixed area.

Magnifier
An Overview used as a magnifying glass.
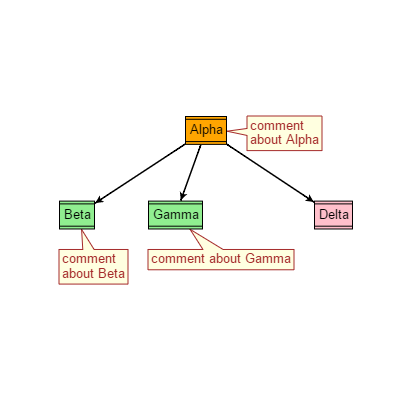
备注
GoJS supports the notion of "Comments", including the ability to create balloon-like comments.

Word Cloud
A word cloud visualization using the PackedLayout extension.

SVG Tiger
Shows a tiger rendered in SVG.
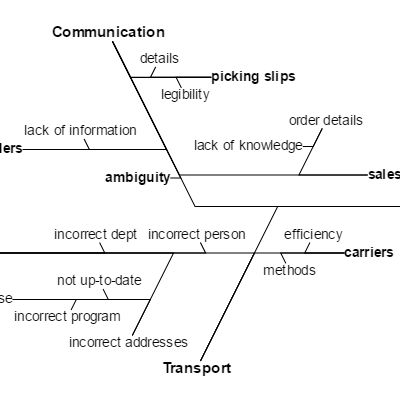
Fishbone Layout
The Fishbone or Ishikawa layout is a tree layout for cause-and-effect relationships.
Parallel Layout
A custom Layout that assumes there is a single 'split' and a single 'merge' node with parallel lines of nodes connecting them.
Serpentine Layout
A custom Layout that positions a chain of nodes in rows of alternating direction.
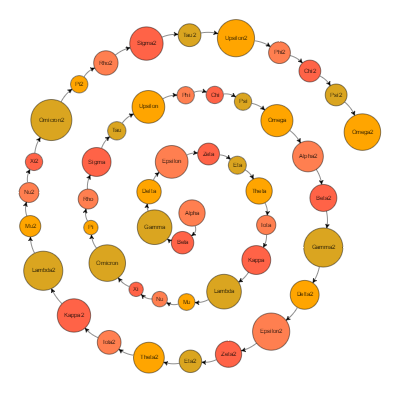
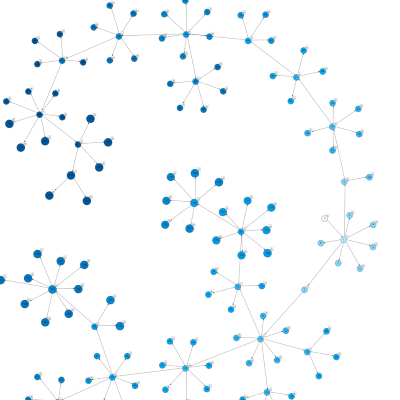
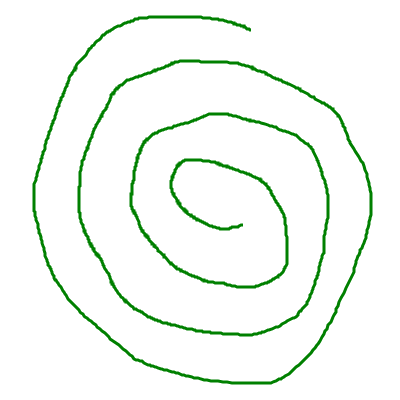
Spiral Layout
A custom Layout that positions a chain of nodes in a spiral.

Tree Map Layout
A custom Layout that renders nested Groups into the viewport with each Node having an area proportional to its declared 'size'.
Table Layout
A custom Layout that arranges Nodes just as a Table Panel arranges GraphObjects.
Packed Layout
A custom Layout that positions nodes in a packed area.
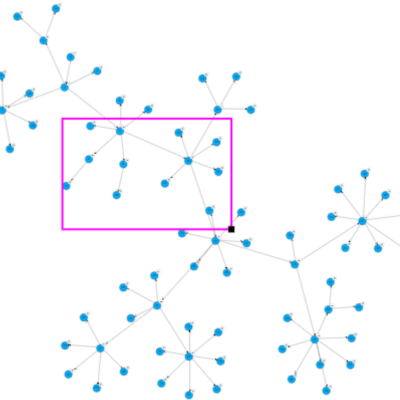
Realtime Drag Selecting
A custom Tool that lets a user drag and create a box to select nodes and links.
DragCreating
A custom Tool that lets a user draw a box showing where and how large a new node should be.
Drag Zooming
A custom Tool that lets a user draw a box showing what to zoom in to.
Resize Multiple
A custom ResizingTool that lets the user resize many selected objects at once.
Rotate Multiple
A custom RotatingTool that lets the user rotate many selected objects at once.
Curved Link Reshaping
A custom Tool that lets the user reshape curved links with a single handle.
Orthogonal Link Reshaping
A custom Tool that lets the user reshape orthogonal links by dragging entire segments.
Overview Resizing
A custom Tool which allows the user to resize the overview box.
Snap Link Reshaping
A custom Tool that allows reshaping links with grid snapping.
Geometry Reshaping
A custom Tool that supports interactive reshaping of Geometries.
Sector Reshaping
A custom Tool that supports interactive reshaping of pie-shaped sectors of circles.
Freehand Drawing
A custom Tool that lets the user interactively draw a line, converting it into a Shape.
Polygon Drawing
A custom Tool that lets the user interactively draw polygons and polyline Shapes.
Polyline Linking
A custom LinkingTool that lets the user determine the route of a new Link by clicking.
Link Shifting
A custom Tool that adds handles on Links to allow the user to shift the end point of the Link along the sides of the port without disconnecting it.
Link Label Dragging
A custom Tool that lets the user drag a label on a Link and that keeps its relative position to the link.
Link Label On Path Dragging
A custom Tool that lets the user drag a label on a Link and that keeps the label along the path of the link.
Node Label Dragging
A custom Tool that lets the user drag a label in a Spot Panel of a Node.
Non Realtime Dragging
A custom DraggingTool that lets the user drag a translucent image of the Nodes and Links to be moved, leaving them in place until the mouse up.
Guided Dragging
A custom DraggingTool that makes guidelines visible as a Part is dragged around a Diagram and is nearly aligned with another Part.
Port Shifting
A custom Tool that lets the user drag a port in a Spot Panel of a Node.
Column Resizing
Two custom Tools that let the user resize the width of columns or the height of rows in a Table Panel of a Node.
Data Inspector
A simple drop-in for inspecting and editing Part data.
Debug Inspector
A more complex inspector for inspecting all sorts of GraphObject, Node, Link, Shape, etc properties, and Part data.
Checkboxes
Demonstrates simple uses of CheckBoxButtons.
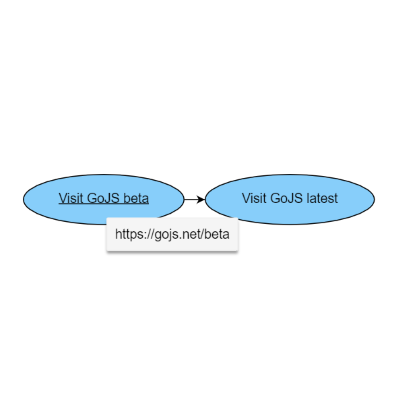
Hyperlinks
Demonstrates usage of the HyperlinkText extension.
HTMLInfo Text Editor
Demonstrates using an HTMLInfo that acts as a re-implementation of the default text editor.
Scrolling Table
Demonstrates a custom Table Panel with a scrollbar implemented in GoJS, including two AutoRepeatButtons.
Two Halves
Demonstrates a Node with a top half and a bottom half, with rounded corners.
Balloon Links
Demonstrates custom Links that create a "Balloon" around the fromNode.
Parallel Route Links
Demonstrates custom Links that route parallel to other Links between the same two ports.
Dimensioning
Demonstrates custom Links that show the distance between two points.
Drawing Commands
Demonstrates custom CommandHandler which provides alignment commands and additional behaviors for the arrow keys.
Local Storage Commands
Demonstrates custom CommandHandler which uses localStorage as the repository for the clipboard, rather than an in-memory global variable, allowing for copying between tabs and windows.

Cloud Storage Manager
Demonstrates dynamically choosing the user's cloud storage service (using the user's credentials) or localStorage.
Simulating Input
Demonstrates use of the Robot class to simulate mouse events.
Zoom Slider
Demonstrates use of the ZoomSlider class to zoom in/out using a control.
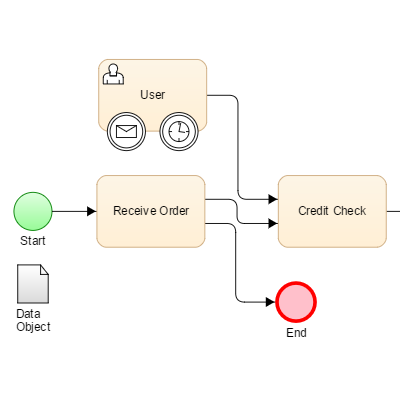
BPMN Editor
The start of a Business Process Model and Notation editor.
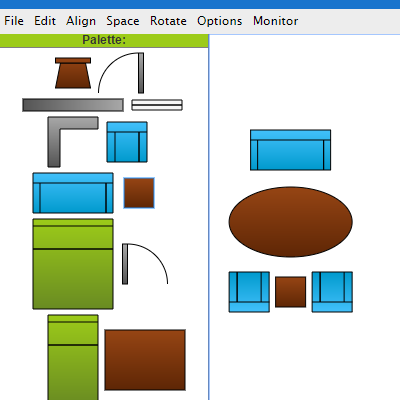
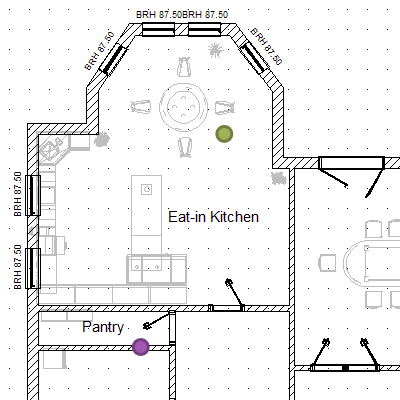
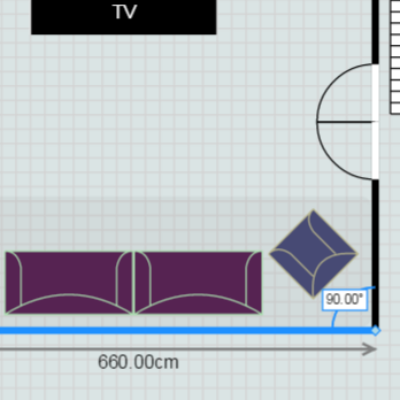
Floor Plan Editor
An editor for users to position, resize, and rotate furniture in a room.
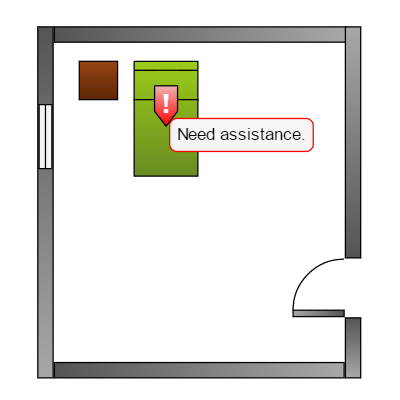
Floor Plan Monitor
A tool to open plans made in Floor Pan Editor and watch simulated alerts.
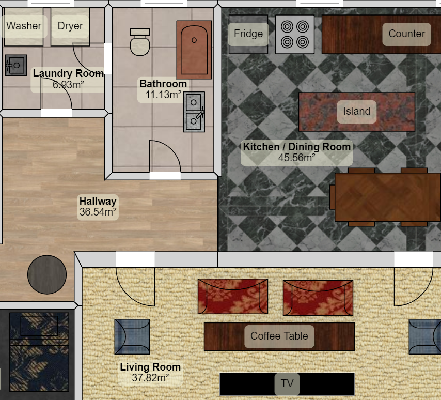
Floor Planner
An editor for users to create robust, detailed floor plans.
Floor Planner (TypeScript)
A feature-rich editor for users to create robust, detailed floor plans.
Minimal JSON
Minimal, loading JSON from server.
Minimal XML
Minimal, loading XML from server.
Minimal Image Download
Minimal, showing image Blob creation with Diagram.makeImageData, and download.
Minimal SVG Download
Minimal, showing SVG creation with Diagram.makeSvg, and download.
Minimal RequireJS
Minimal, using RequireJS.
Minimal AngularJS
Minimal, using AngularJS.

Minimal Vue.js
Minimal, using Vue.js.
Spacing Zoom
When zooming, change the spacing of the Nodes, not the Diagram.scale.
手势行为
Shows different options for ToolManager's gestureBehavior.
Pinch Zooming
Demonstrates customization of pinch-zooming to scale a node.
Hover Buttons
Shows buttons in an Adornment upon hover over a node.
Scroll Modes
Shows infinite scrolling and positionComputation.
Custom Expand and Collapse
Shows how to create Buttons with custom behavior for expanding/collapsing of a graph.
Constant Size
Kitten Monitor with constant size markers and tooltips when zooming out.
Virtualized
Virtualized no Layout, an example of virtualization where the model holds 123,456 node data yet the diagram only creates a few nodes at a time.

Virtualized Tree
An example of virtualization where the model holds 123,456 node data yet the diagram only creates a few nodes at a time.
Virtualized TreeLayout
Shows a virtualized TreeLayout with TreeModel.
Virtualized ForceDirected Layout
Shows a virtualized ForceDirectedLayout with GraphLinksModel.
Flow Builder
Demonstrates a flow builder where nodes/links can be created or dropped onto a recycling node.
Flowgrammer
Demonstrates a flow-chart-like editor of a restricted syntax language.
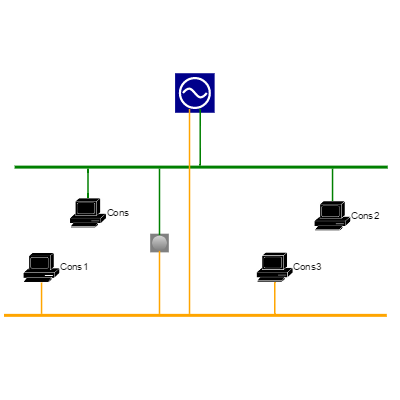
Network
Shows a network configurator with a Palette and Overview.
Incremental State Chart
State Chart using incremental JSON.

Regrouping Scaled
Regrouping with nested groups scaled ever smaller.
Regrouping Tree View
Regrouping with tree view of grouping hierarchy.
Drag Out Fields
Drag out fields from record Nodes to an HTML element.
Drag and Drop Fields
Drag and drop fields from/to record Nodes.
Two Diagrams
Demonstrates drag and drop between two different diagrams using a shared UndoManager.
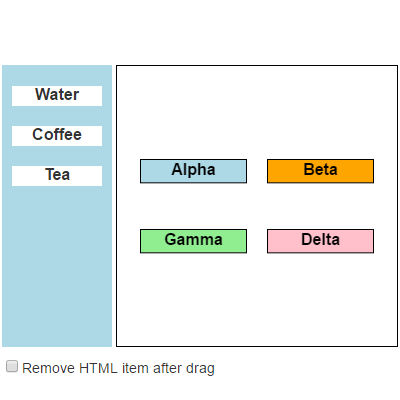
HTML 拖放
Demonstrates dragging and dropping from HTML.

jQuery 拖放
Demonstrates dragging and dropping from HTML using jQuery.
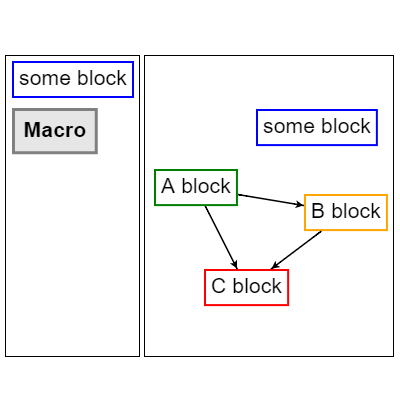
Macros
Demonstrates an automatic ungrouping of nodes when dropping an element on the diagram.
Drag Unoccupied
Demonstrates a function to avoid any overlapping of nodes during dragging.
自定义右键菜单
Shows a LightBox style HTML Context Menu.
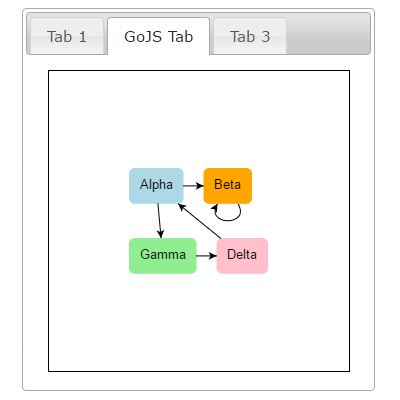
jQuery Tabs
Shows how to create a Diagram within a jQuery UI Tab.
Panel Layout
Shows how to create a custom PaneLayout.
